DNA Report page 3
Ta
drivers such as BAP1, NF2, TP53, LATS2 and SETD2. On copy number variant analysis copy number alter- ations (CNAs) were apparent mostly similar in frequently altered genomic region between baseline and relapse biopsy such as chr8q gain, and chr3p and chr9p loss, but also some regions were different such as loss of hetero- zygosity on chr6q and chr4q in baseline only (figure 4). Three independent measurements of genomic instability (basis of loss of heterozygosity, telomeric allelic imbal- ance and large-scale state transitions) show baseline biopsy had unstable genome with higher HRD (homol- ogous recombination deficiency) score. Immune-related somatic mutations are detailed in table 2. All immune- related somatic mutations present in the baseline biopsy were not present in the relapse biopsy. The relapse biopsy had missense mutation in BTN2A1 (c.1352G>C).
disCussion And ConCLusion
dynamic immune changes and changes in tumor mutational burden (tMb) map the clinical response to pembrolizumab The differences seen in levels of T cell infiltration between the two biopsies in this patient demonstrate the dynamic changes that occur in the context of CPI treated malignancy. Three cancer-immunity phenotypes have been described. The first is ‘immune desert’, which can be a result of tolerance, immunological ignorance or lack of priming. In this situation, no immune response
Open access
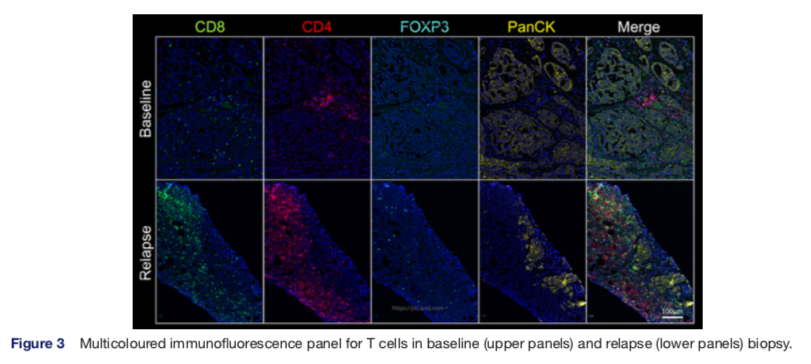
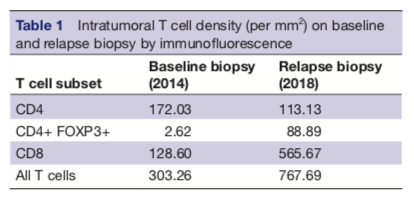
is mounted to the cancer and little T cell infiltration is seen. The second is the ‘immune excluded’ tumor in which there is a barrier to immune cell migration to tumor caused by stromal interactions, vascular barrier and, again, no T cell infiltration is demonstrated. Third, the ‘inflamed’ tumor demonstrate infiltration by immune cells. Inhibitory factors (eg, PD-L1) and T cell exhaustion may still impair anticancer immunity in this setting.6 T cell exhaustion describes a progressive loss of T cell function occurring on persistent antigen presentation.7 Relapse biopsies in this patient demonstrate increased immune cell infiltrate of CD3 CD8 and CD4 T cells, compared with baseline. This is indicative of immune activation as a result of the primary immunotherapy treatment (a move from an immune desert to inflamed tumor) and is consis- tent with the prolonged response. However, there is also an increase in FOXP3 positive T cell, a marker of regula- tory T cells and PD-L1. Therapeutic targeting of PD-1 is known to effect regulatory T cell function but not overall number.8 We may consider the increase in regulatory T cells a marker of immune exhaustion. These markers of immune exhaustion represent emerging resistance to immunotherapy as evidenced by the clinical progres- sion. Despite these markers of immune exhaustion, a response to pembrolizumab rechallenge was achieved, thus resistance to immunotherapy was not complete. The finely tuned balance of immunostimulatory and immu- nosuppressive elements demonstrated in these sequential biopsies in combination with the radiologic data present a compelling visualization of immune activation and exhaustion and clinical implications. A disadvantage of this study is that single biopsies were taken, and there may be heterogeneity of immune infiltrates throughout the tumor burden. Ongoing trials address the potential in mesothelioma for drug combinations to move tumors to the inflamed phenotype and overcome CPI resistance. Preclinal
Figure 3 Multicoloured immunofluorescence panel for T cells in baseline (upper panels) and relapse (lower panels) biopsy. Minchom A, et al. J Immunother Cancer 2020;8:e000713. doi:10.1136/jitc-2020-000713 3